How to Access and Use Interactive Dashboards in Salesforce for QuickBooks Integration
December 19, 2025Team QB Sync Made Easy2 min read
Share This Article
QB Sync Made Easy brings interactive dashboards to make your Salesforce and QuickBooks Online integration even easier. With this update, you can view your QuickBooks data visually inside Salesforce and understand your financial records quickly. These dashboards support smooth QuickBooks integration, clear data comparison, and better decision-making.
In this guide, we’ll show you the steps to view and use these dashboards in a simple and effective way.
How to View Dashboards in QB Sync Made Easy
Here are the steps to view the company-level dashboard.
1. Company-Level Dashboards
This view is prebuilt and requires no configuration from the user.
Steps:
Log in to your Salesforce org.
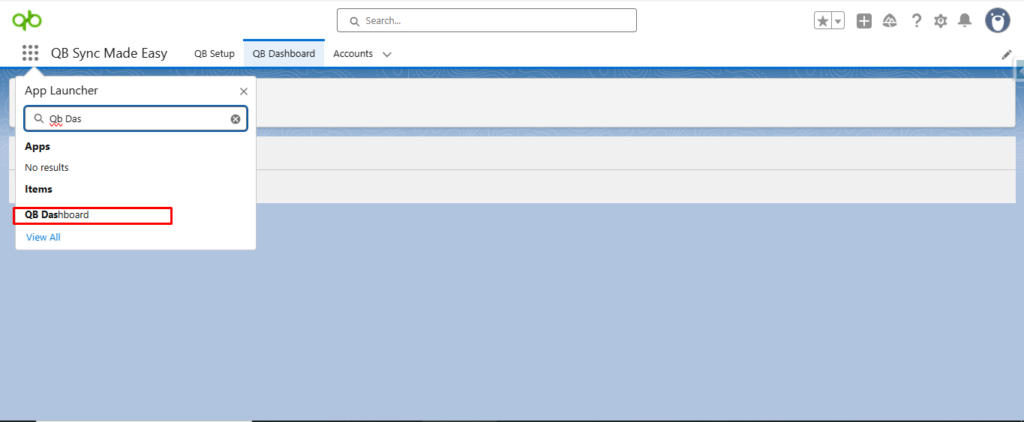
Navigate to the “QB Dashboard” tab from the Salesforce navigation bar.
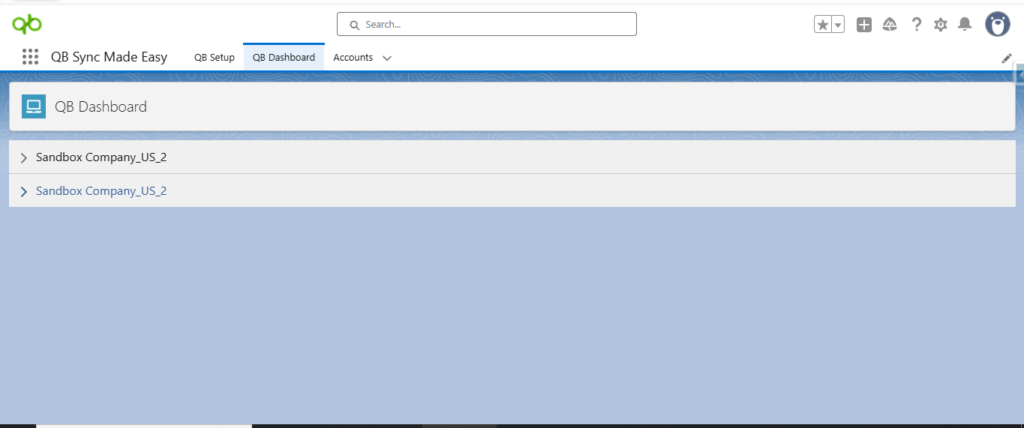
The dashboard automatically displays all connected QuickBooks companies.
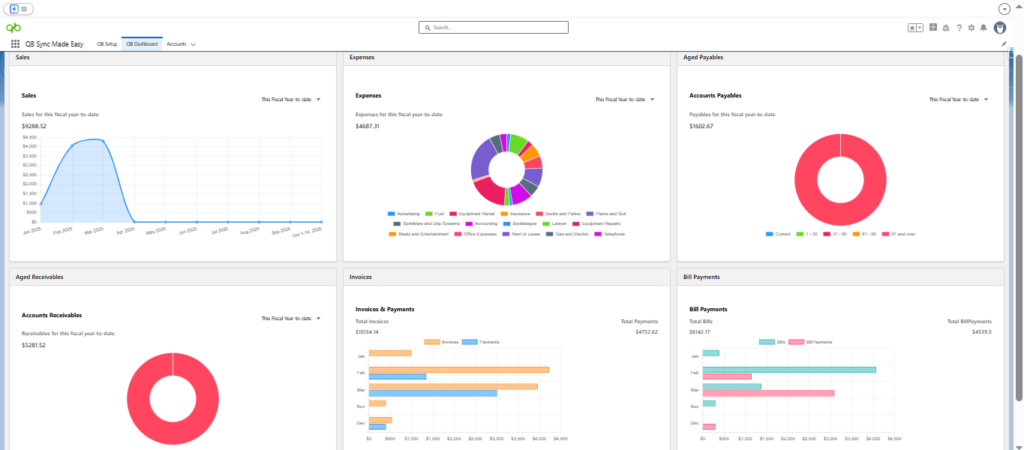
Browse the prebuilt charts and reports to get a visual overview of sales, invoices, expenses, and other key data.
No additional setup or customization is required – users can start analyzing immediately.
Now, let’s move toward the record-level dashboard.
2. Record-Level Dashboards
This view allows users to customize dashboard components on specific record pages.
Steps:
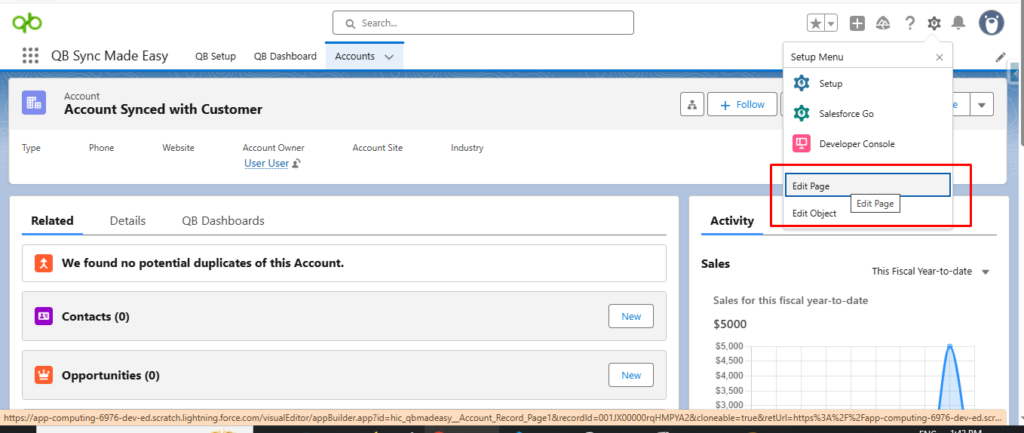
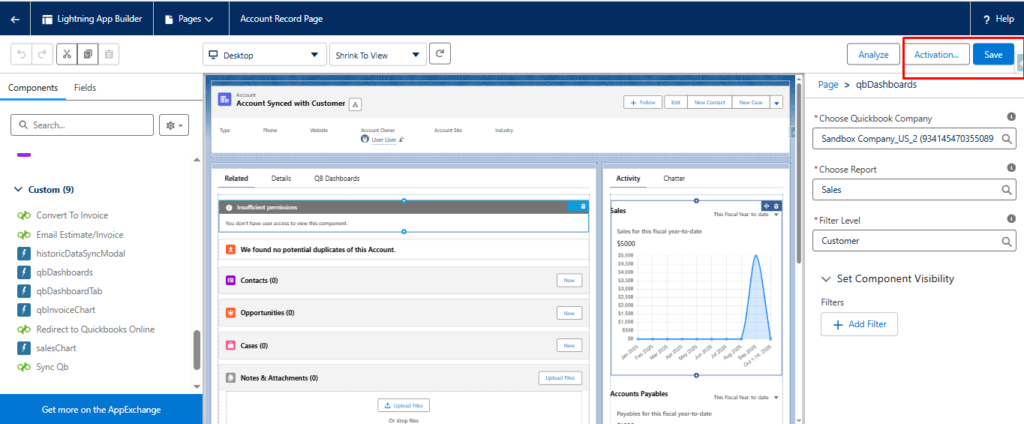
Open the Salesforce record page where you want the dashboard (e.g., Account).
Click the gear icon → Edit Page to enter the Lightning App Builder.
Drag and drop the QB Dashboard component onto the page layout.
Configure the component by selecting:
The QuickBooks Company whose data you want to display.
Report Type (e.g., Sales, Expenses, Accounts Payable).
Filter Level (e.g., Company, Customer, Vendor, Department ).
Click Save and Activate the page.
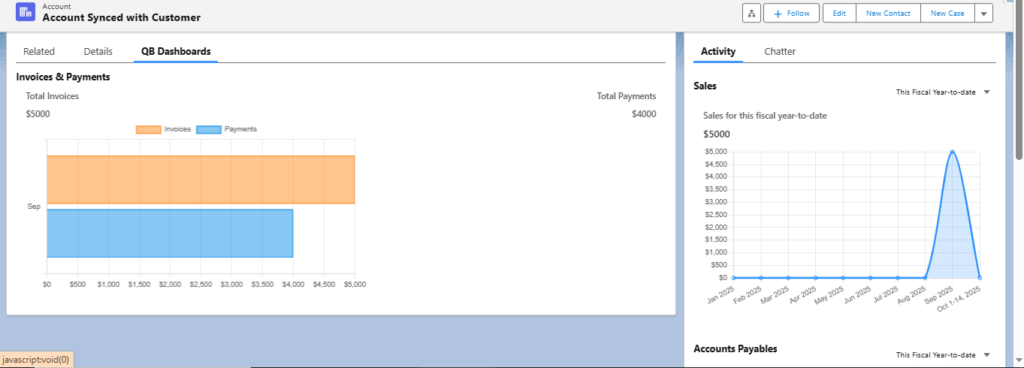
Navigate back to the record page to view the dashboard component in action.
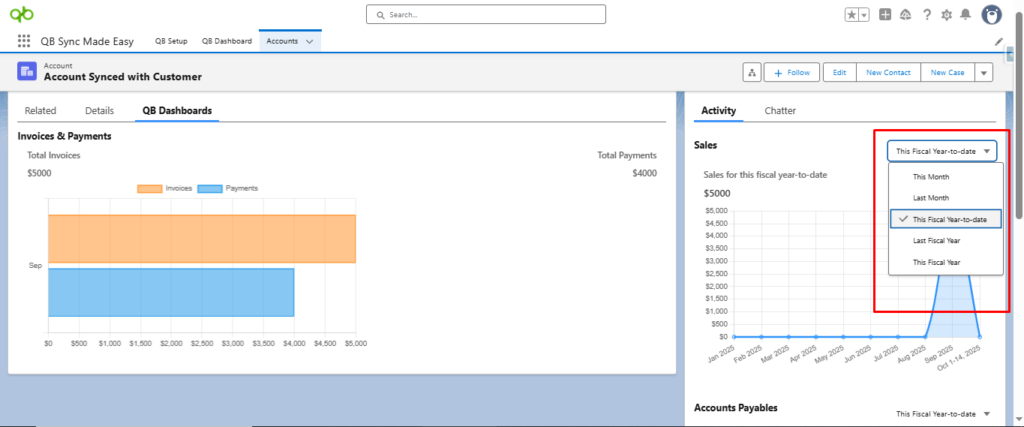
Users can also change the date range to view report data for different periods.
Conclusion
Interactive dashboards in QB Sync Made Easy makes financial analysis effortless by bringing QuickBooks data straight into Salesforce. With prebuilt views, easy comparison, and full customization, this update improves the way you monitor sales, expenses, invoices, and more.
If you rely on Salesforce and QuickBooks Online integration, these dashboards give you a clearer, faster, and smarter way to understand your business data, all in one place.
Frequently Asked Questions
Interactive dashboards allow you to view and analyze your QuickBooks Online data visually inside Salesforce. They present key financial information like sales, invoices, and expenses in easy-to-understand charts and reports.
No. Company-level dashboards are prebuilt and require no setup. Once your QuickBooks companies are connected, the dashboards automatically display all relevant financial data.
Yes. Record-level dashboards can be customized using Lightning App Builder. You can select the QuickBooks company, report type (sales, expenses, accounts payable), and filter level to match your needs.
Yes. Users can easily adjust the date range to view financial data for different periods, making trend analysis and comparisons simple.
Record-level dashboards can be added to standard and custom Salesforce record pages, such as Accounts, Opportunities, or Vendors, depending on your business workflow.